+1k images collected and analyzed
8 interactive visualization designed
Project Language
English
My role
Once we established the areas of interest and identity guidelines together, I focused on research questions 03 (fine arts) and 05 (erotic magazines). I managed the entire design process, from defining the research questions and collecting and analyzing data to designing the visualizations and identifying the main findings.
Context
Before starting this project, we were asked to pick a topic from a list. We chose online censorship, specifically of images, as it presented an interesting opportunity for qualitative research.
Online censorship involves controlling or removing specific public content by governments or platforms aiming to regulate it. As visual content production grows exponentially, these policies have become increasingly detailed and numerous. This phenomenon impacts more users, raising significant questions: Why is some content censored? Who is responsible for the censorship? Where is the boundary between appropriate and inappropriate content? Censorship can sometimes act silently, leaving users unaware, while at other times it is blatantly evident, prompting users to seek ways to respond or bypass it.
We were tasked with using digital methods to conduct the research, and we aimed to come up with innovative ideas on how to study images with them.
Goal
To investigate, present, and visualize how censorship is applied to images based on content and platform type through digital methods.
Process
- Defined areas of interest and established identity guidelines for visual consistency.
- Designed research questions and protocols, and collected and analyzed data for each.
- Designed tailor-made and non-conventional visualizations for each research question, ensuring the inclusion of collected images.
- Selected the main findings for each protocol and developed a website to present the results.
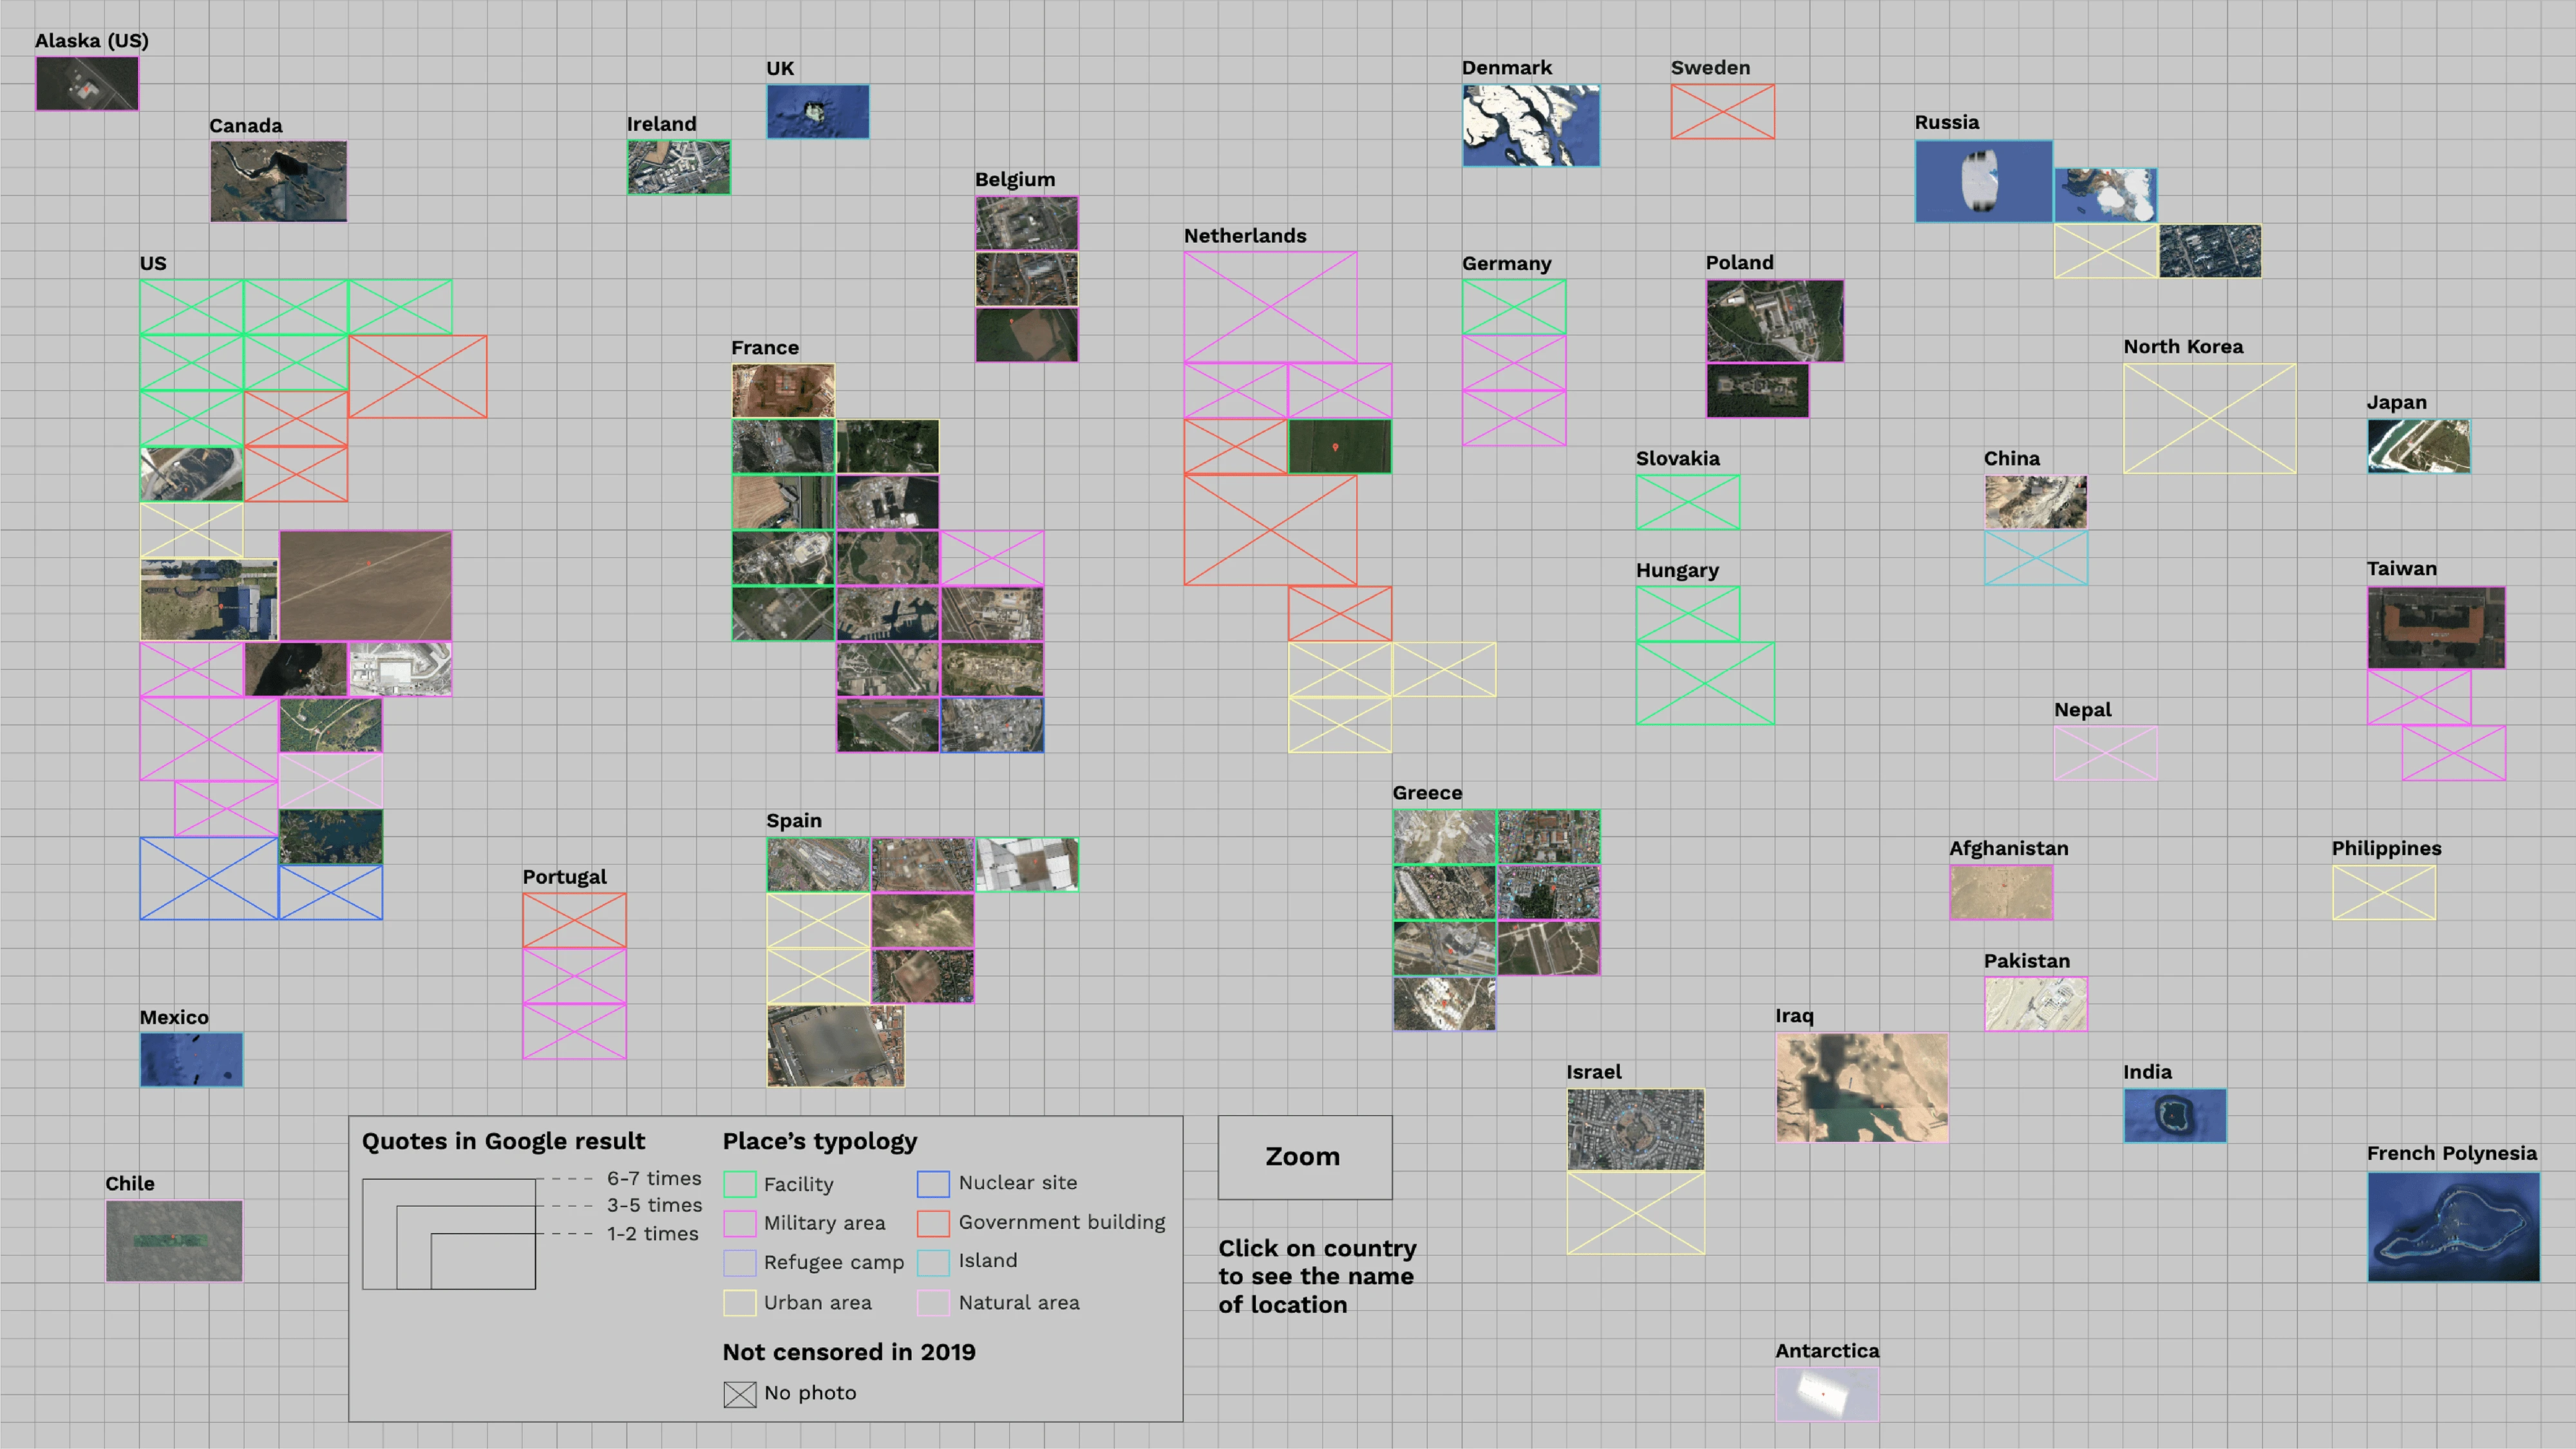
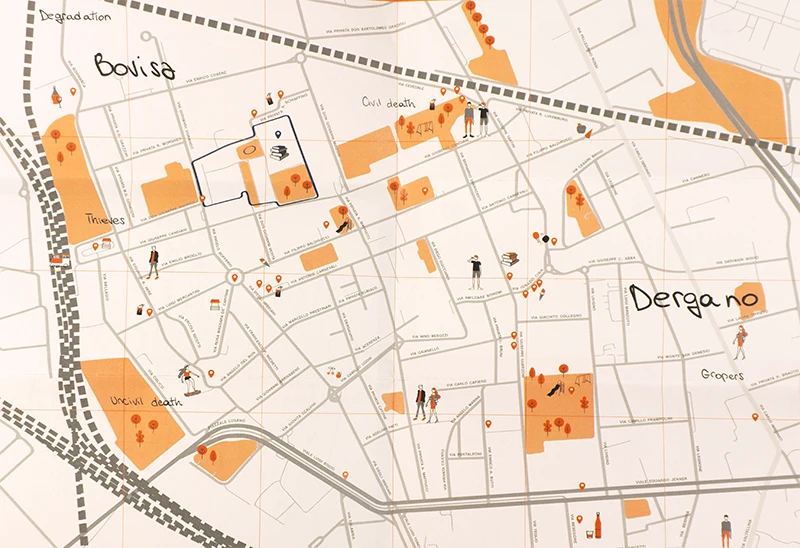
↑ Research question 1: What is Google’s ranking of censored places on Google Maps and what kind of places are they?
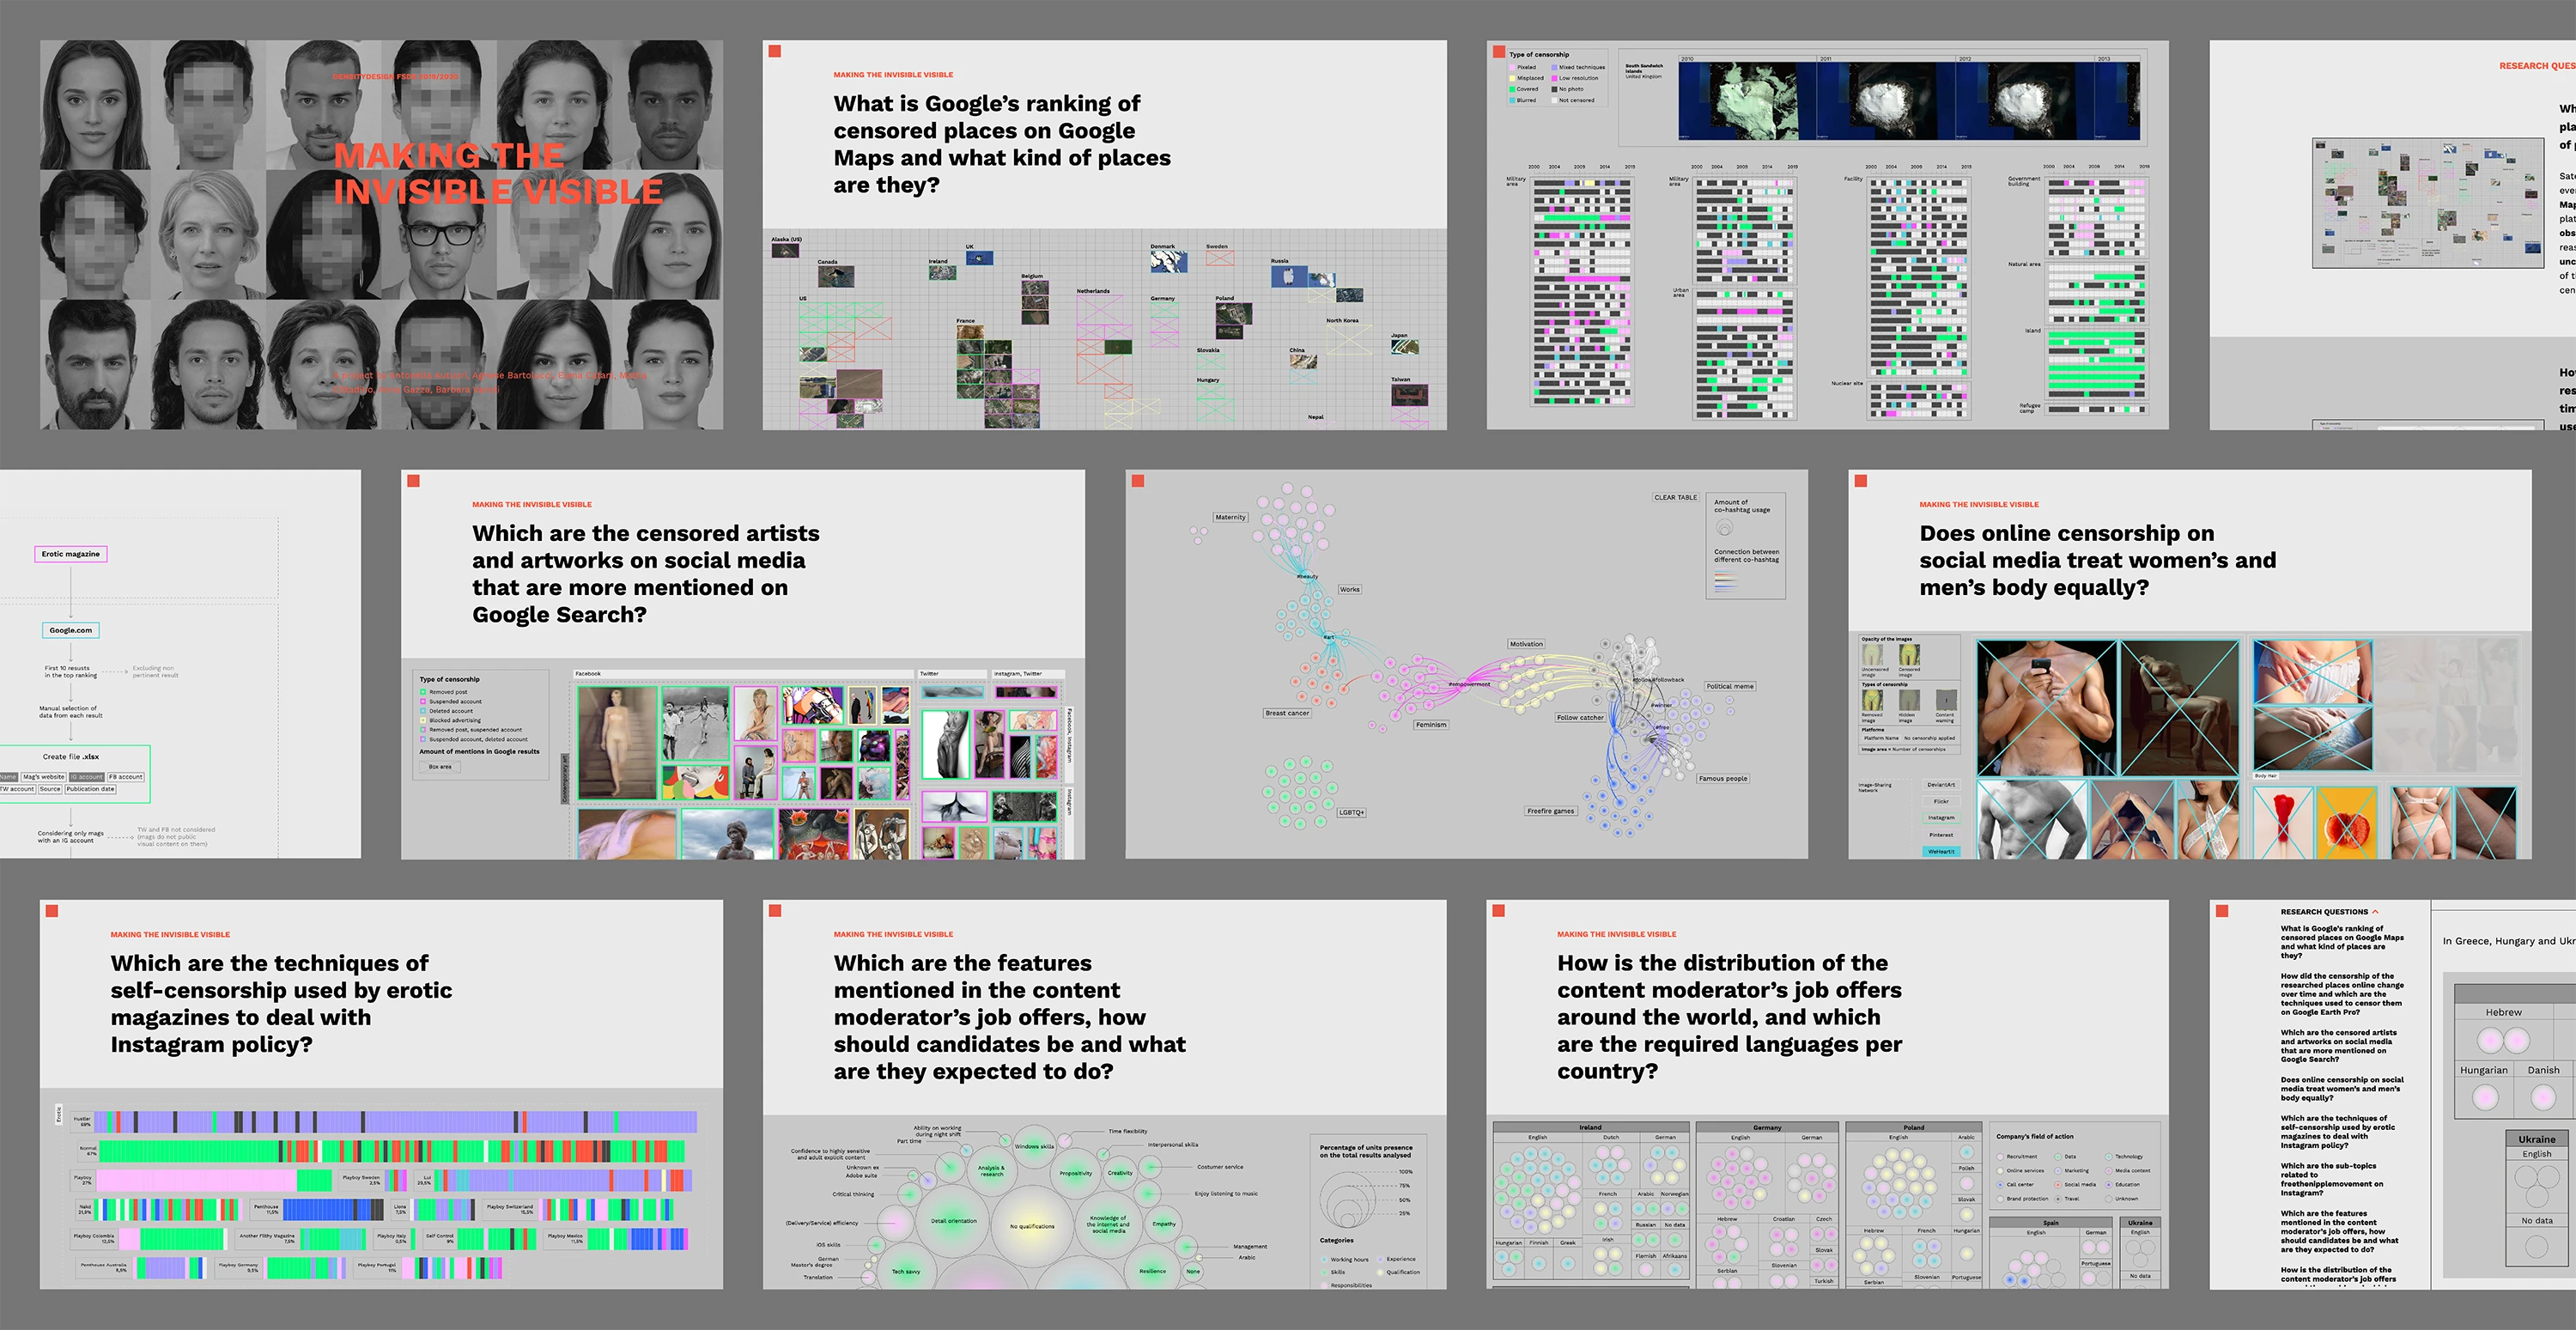
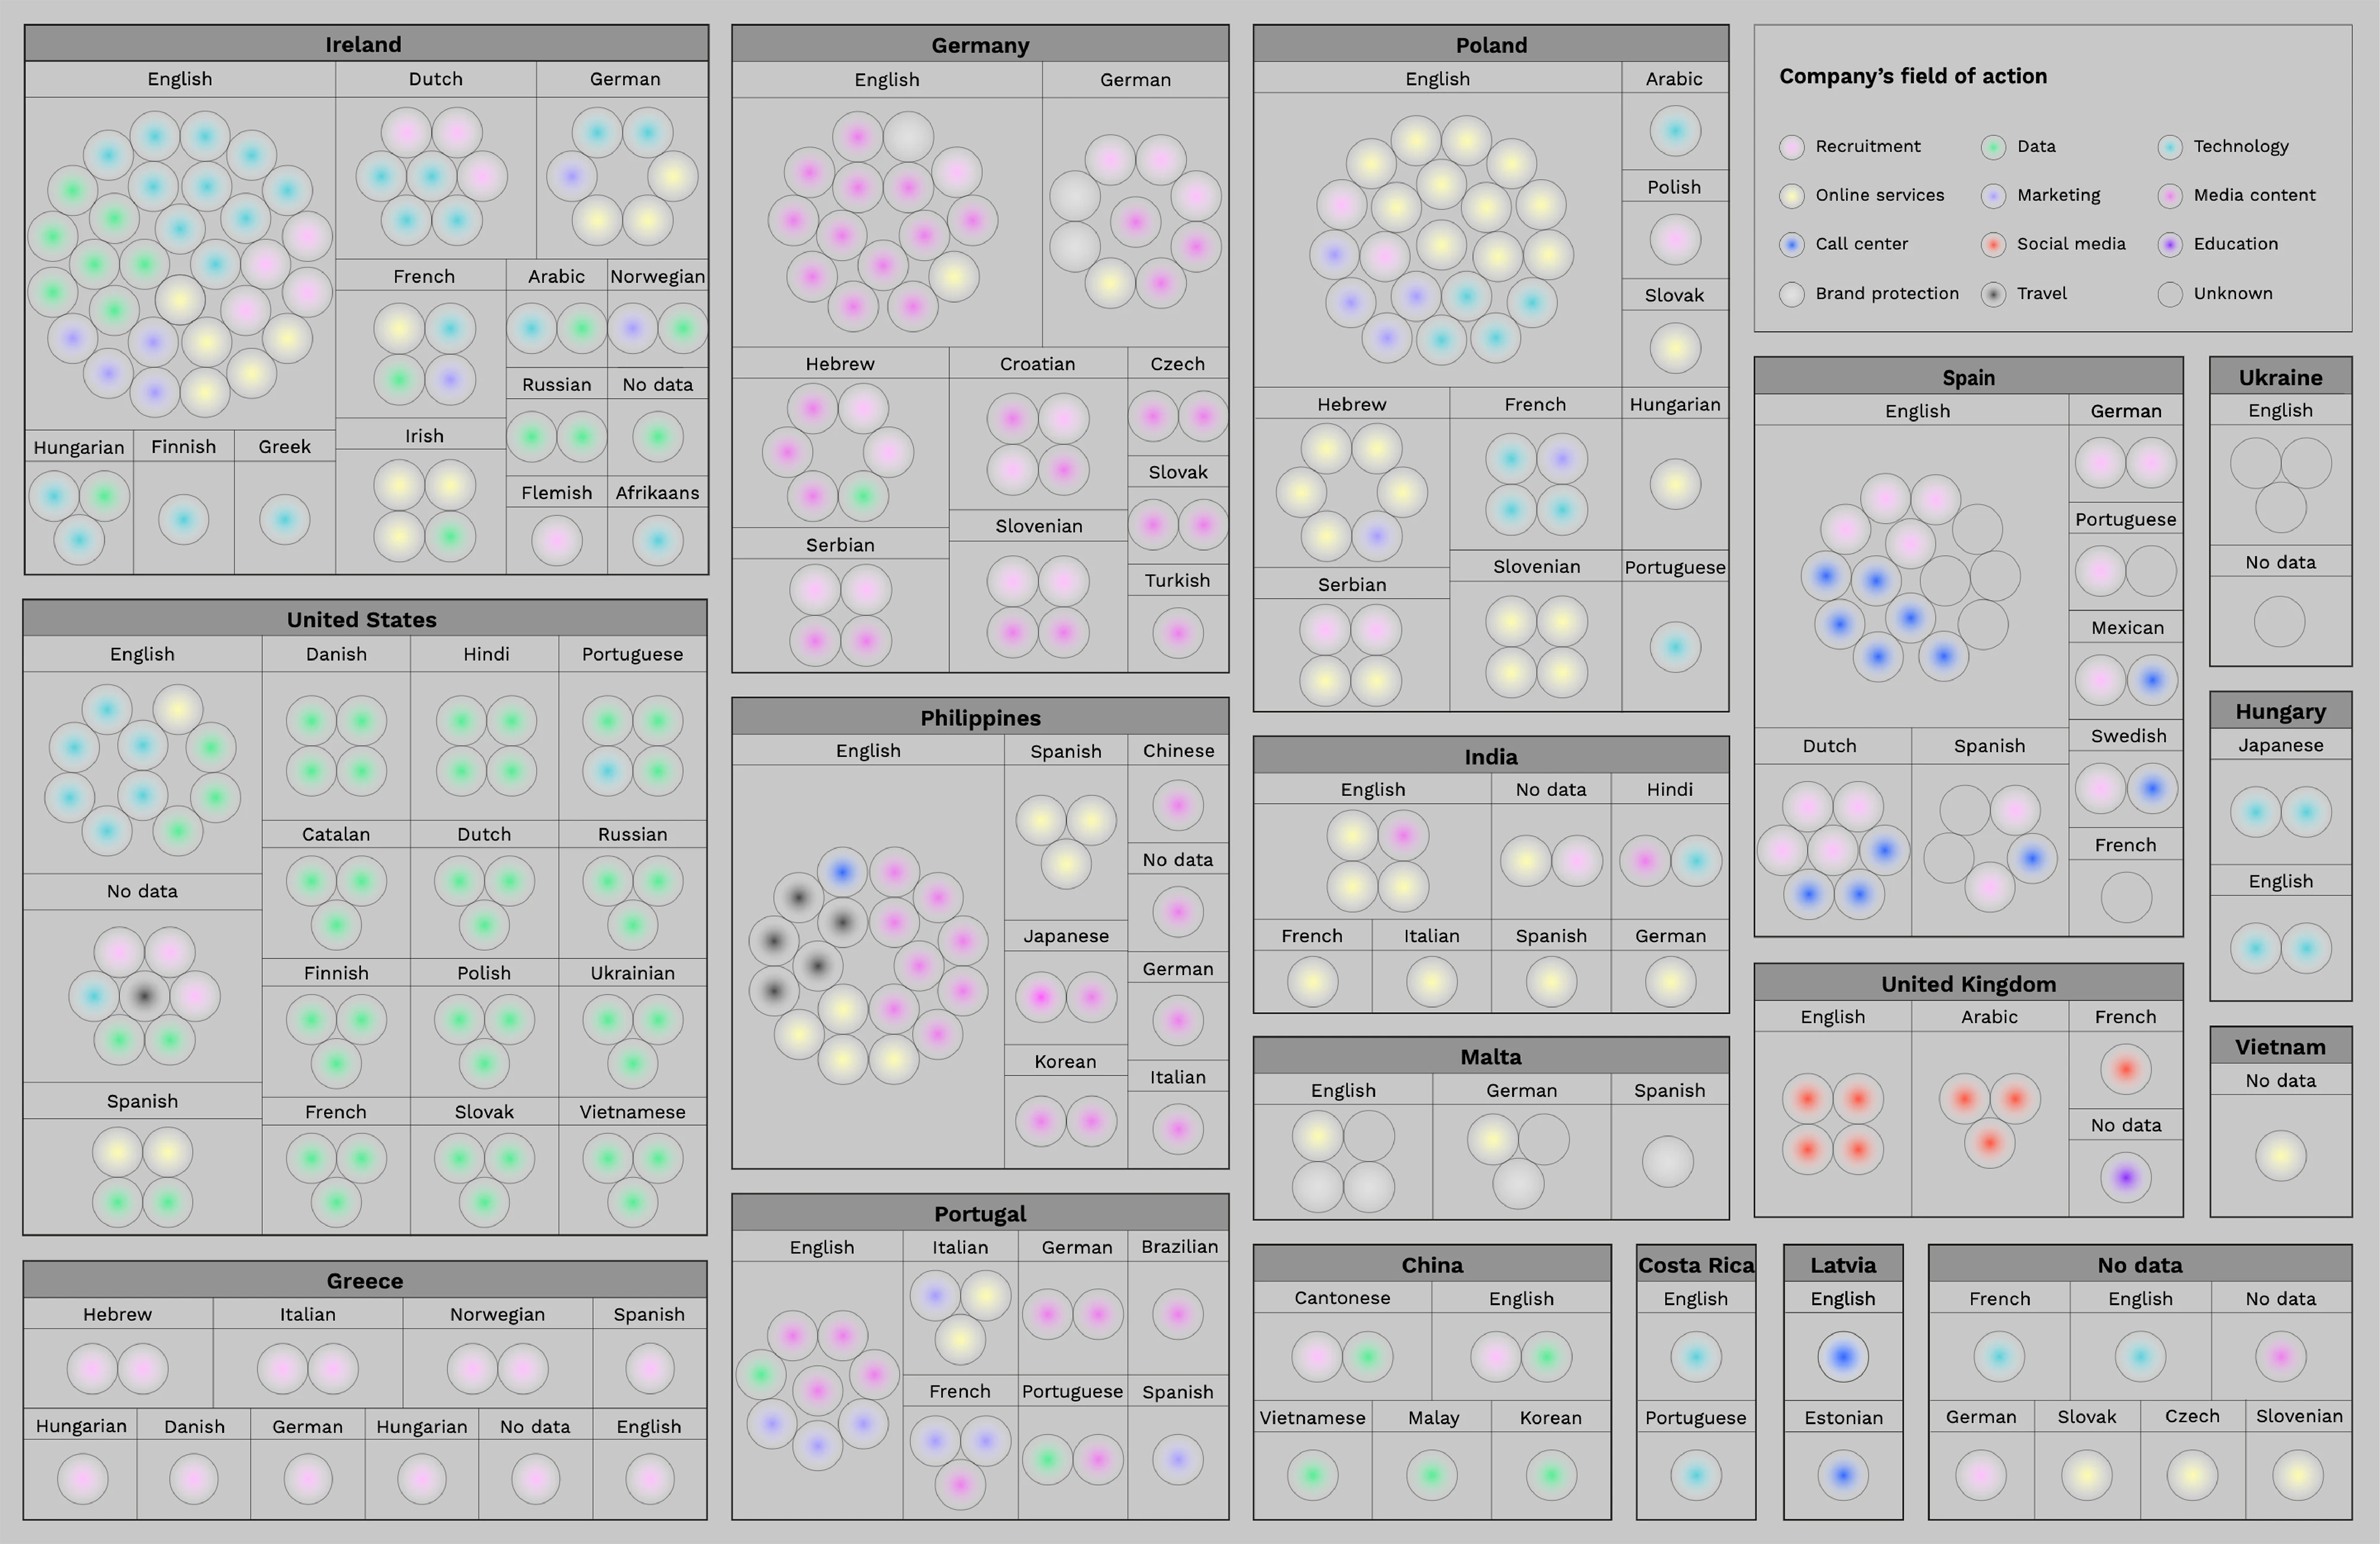
My team and I developed eight different research questions to explore the theme of image censorship online: (1) What is Google’s ranking of censored places on Google Maps and what kind of places are they?, (2) How did the censorship of the researched places online change over time and which are the techniques used to censor them on Google Earth Pro?, (3) Which are the censored artists and artworks on social media that are more mentioned on Google Search?, (4) Does online censorship on social media treat women’s and men’s bodies equally?, (5) Which are the techniques of self-censorship used by erotic magazines to deal with Instagram policy?, (6) Which are the sub-topics related to freethenipplemovement on Instagram?, (7) Which are the features mentioned in the content moderator’s job offers, how should candidates be and what are they expected to do?, and (8) How is the distribution of the content moderator’s job offers around the world, and which are the required languages per country?
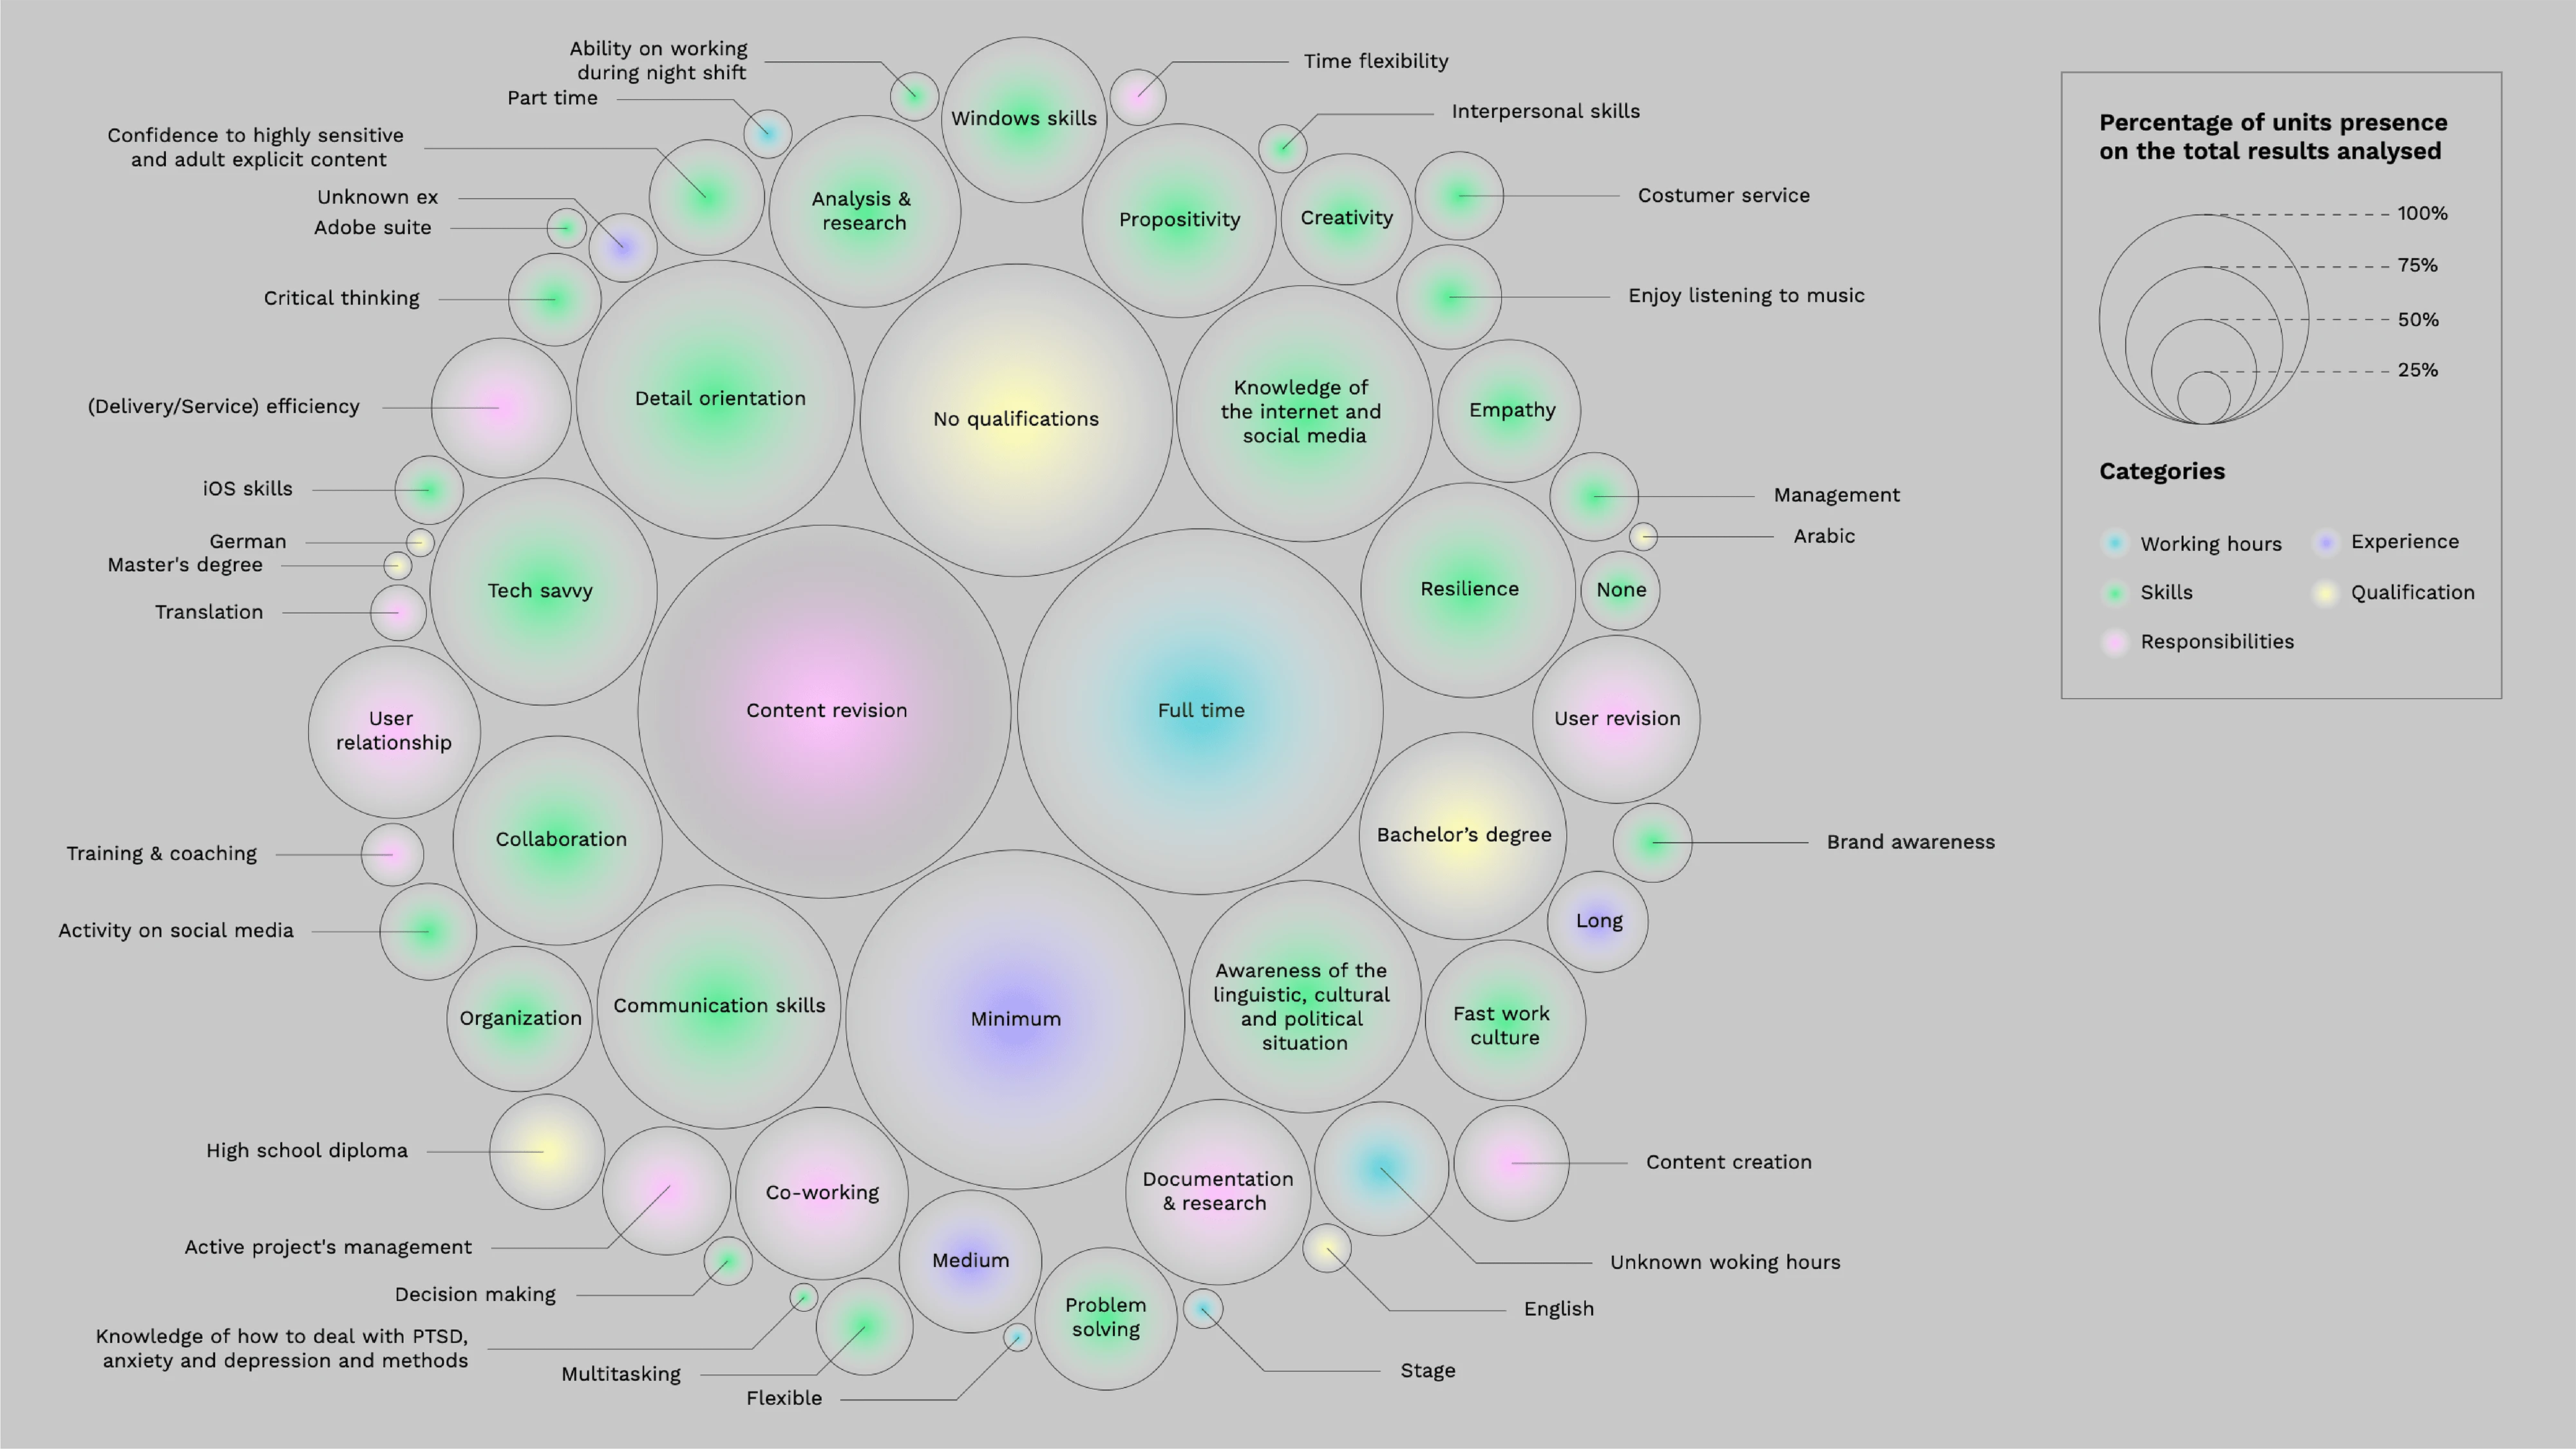
↑ Research question 7 and 8 are about the individuals behind the phenomenon
These questions delve into three levels of depth regarding censorship:
- Types of censored content and the visual languages employed.
- Responses elicited by censorship, including anti-censorship movements and methods users employ to circumvent it.
- The individuals behind the phenomenon.
While I advised on collecting and analyzing data for questions 4 and 6, my focus was on questions 3 and 5, which I managed entirely.
Research question 3: Which are the censored artists and artworks on social media that are more mentioned on Google Search?
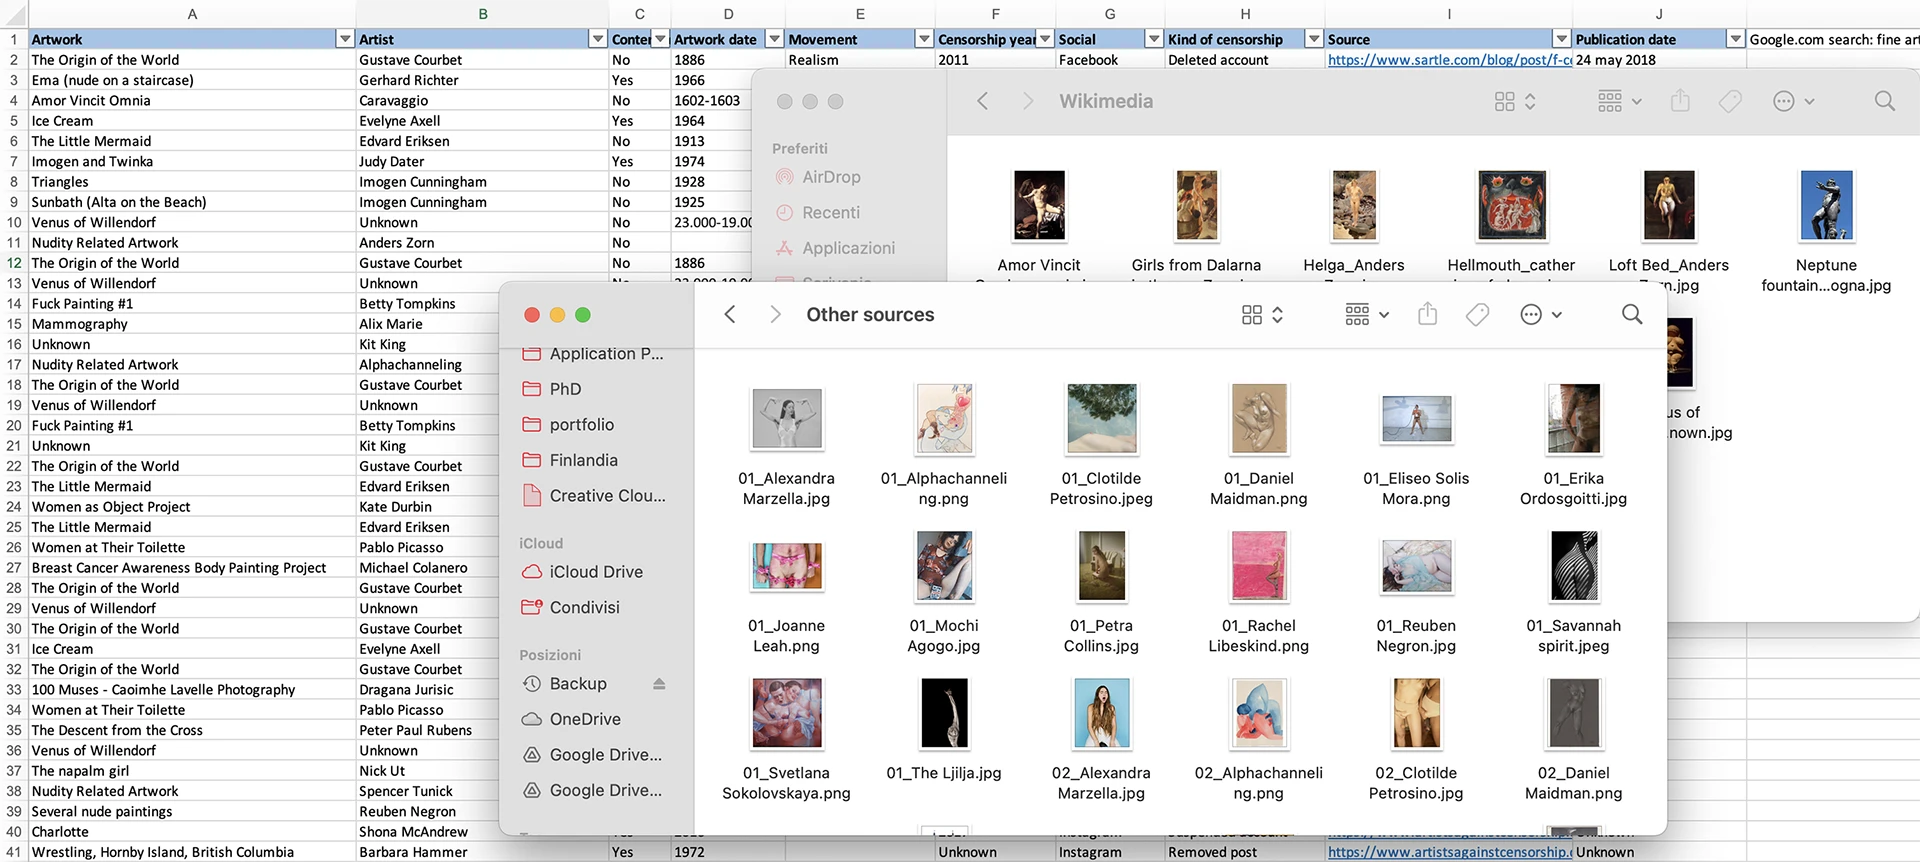
I began by collecting censored artwork and artist names from the first 100 relevant Google results. This provided a dataset on which artworks and/or artists were censored on which platforms and how. I then created an image database of the artists’ works or specific artworks from Wikimedia or Google Images.
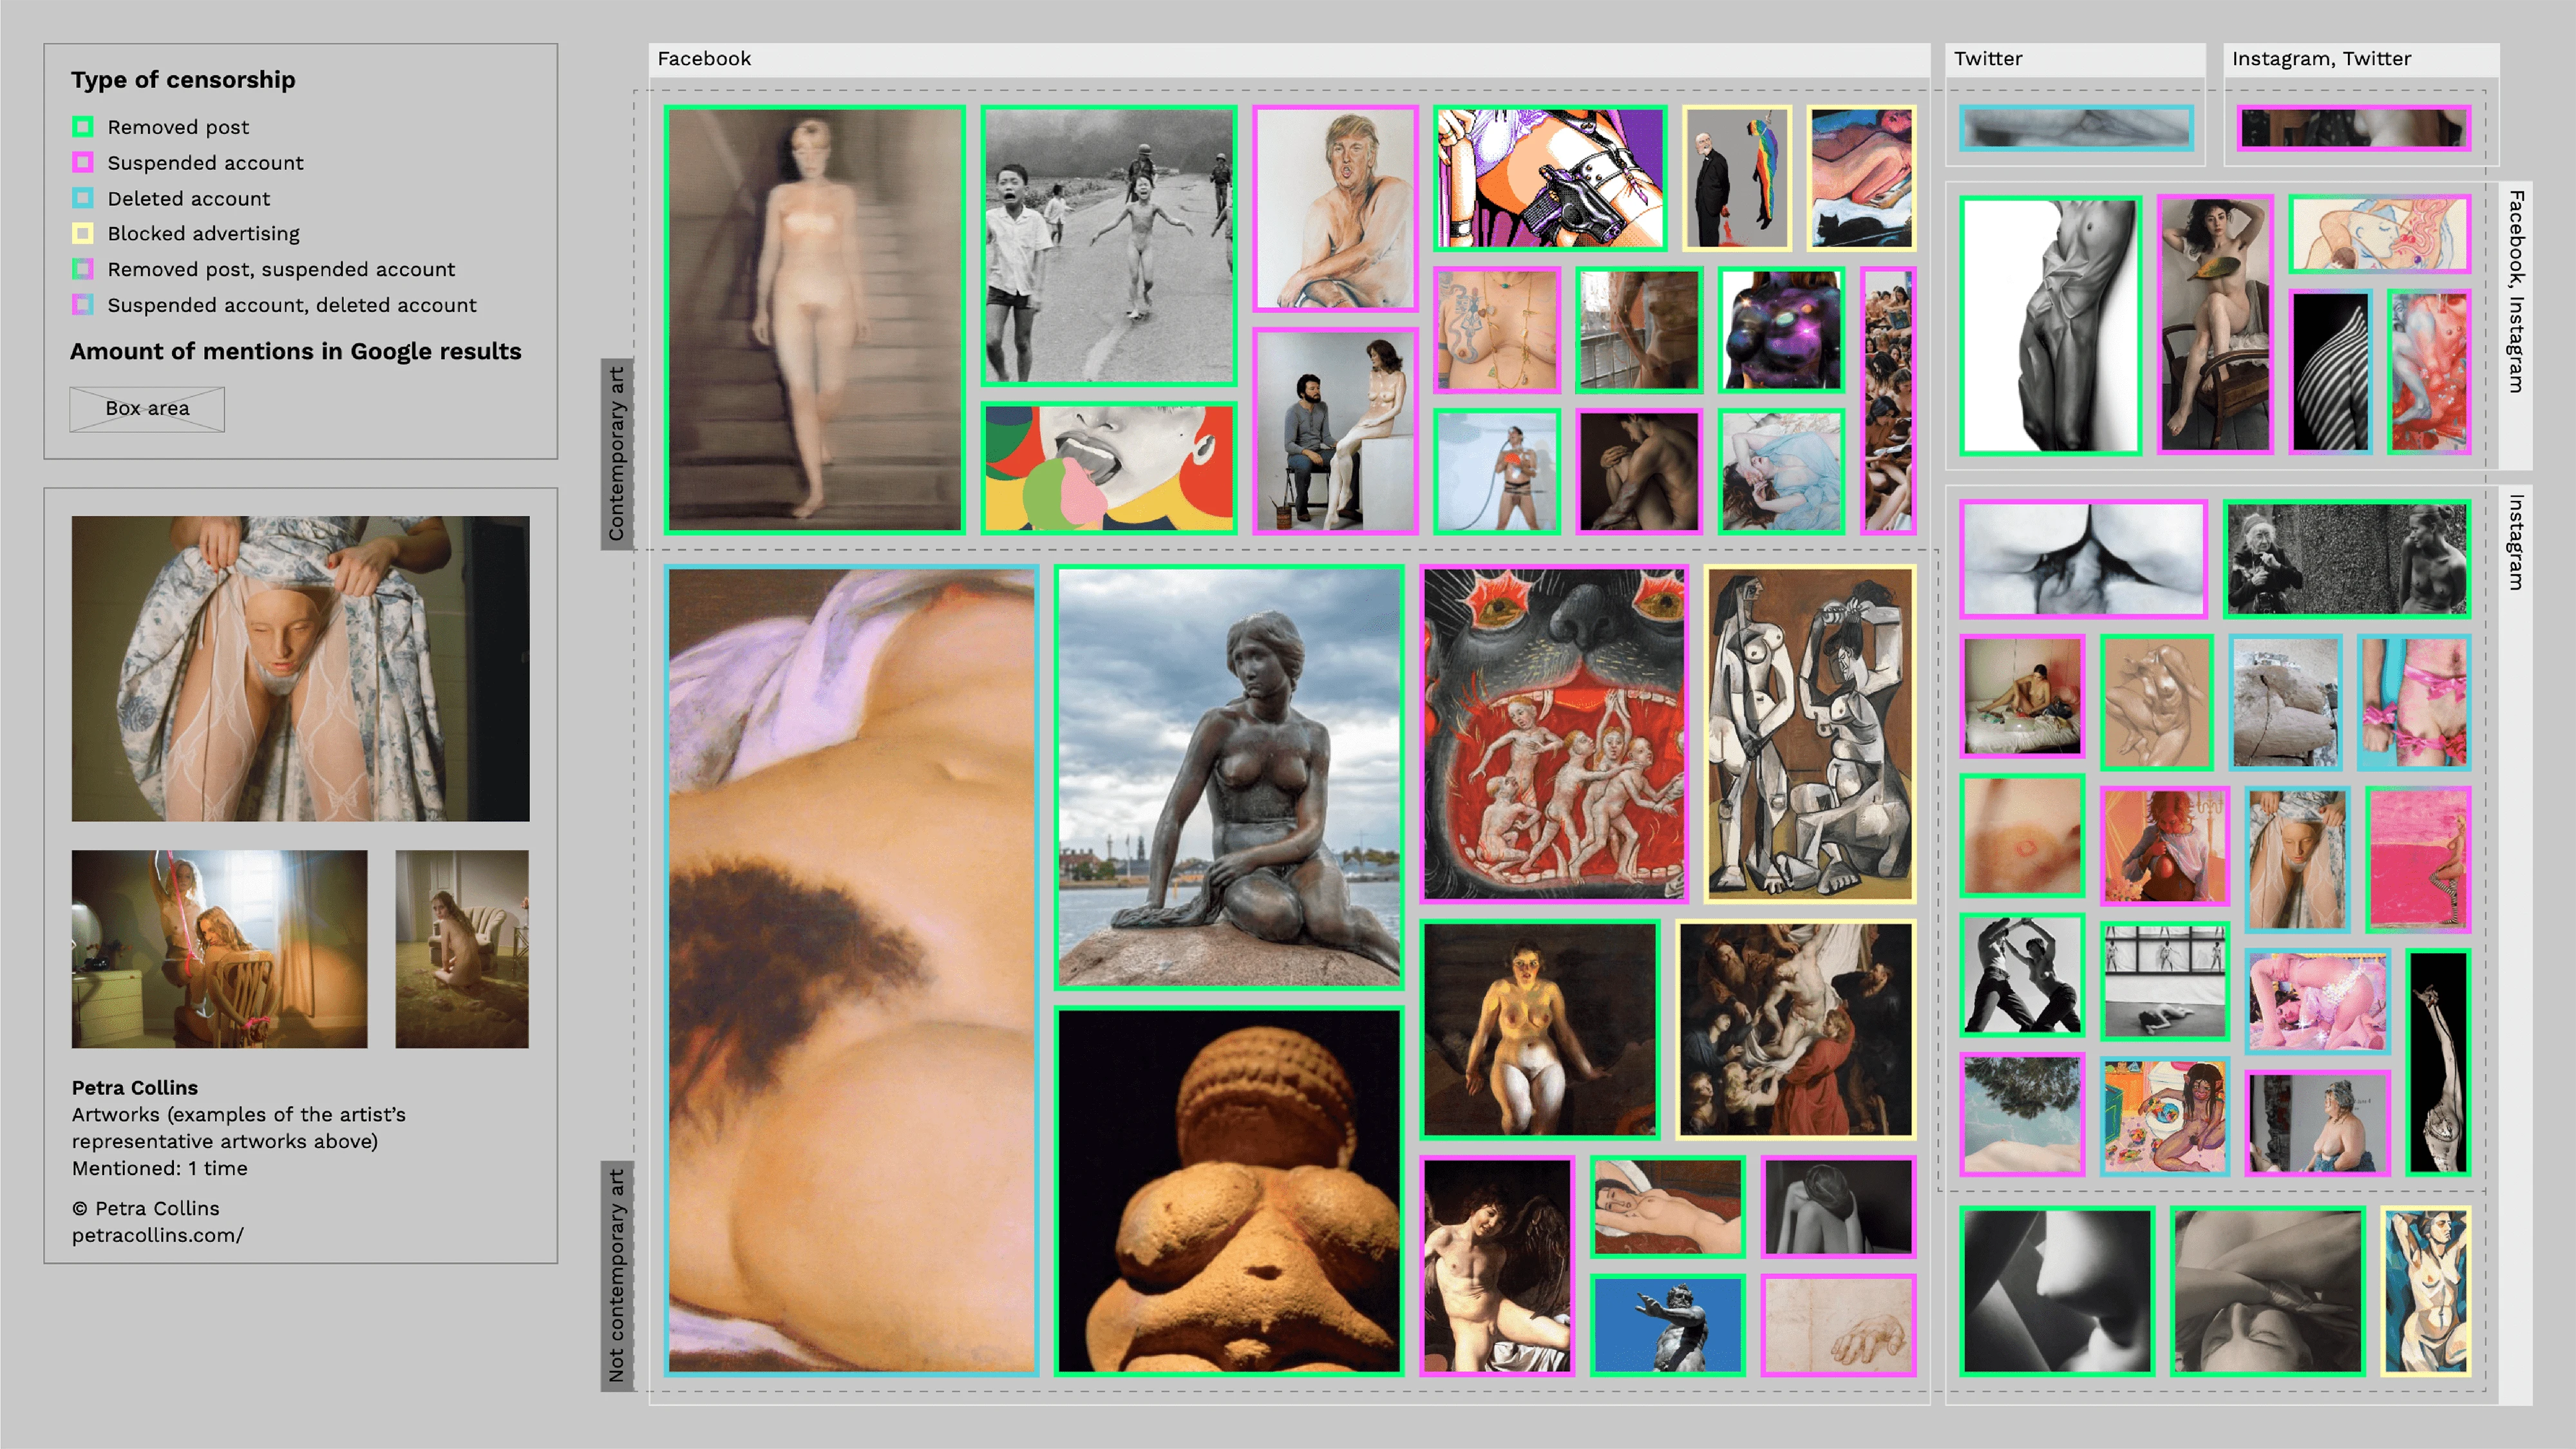
I designed a treemap visualization to make it clear which artworks were most frequently mentioned, creating a visual censorship gallery where each artwork is framed by the type of censorship it faced.
Research question 5: Which are the techniques of self-censorship used by erotic magazines to deal with Instagram policy?
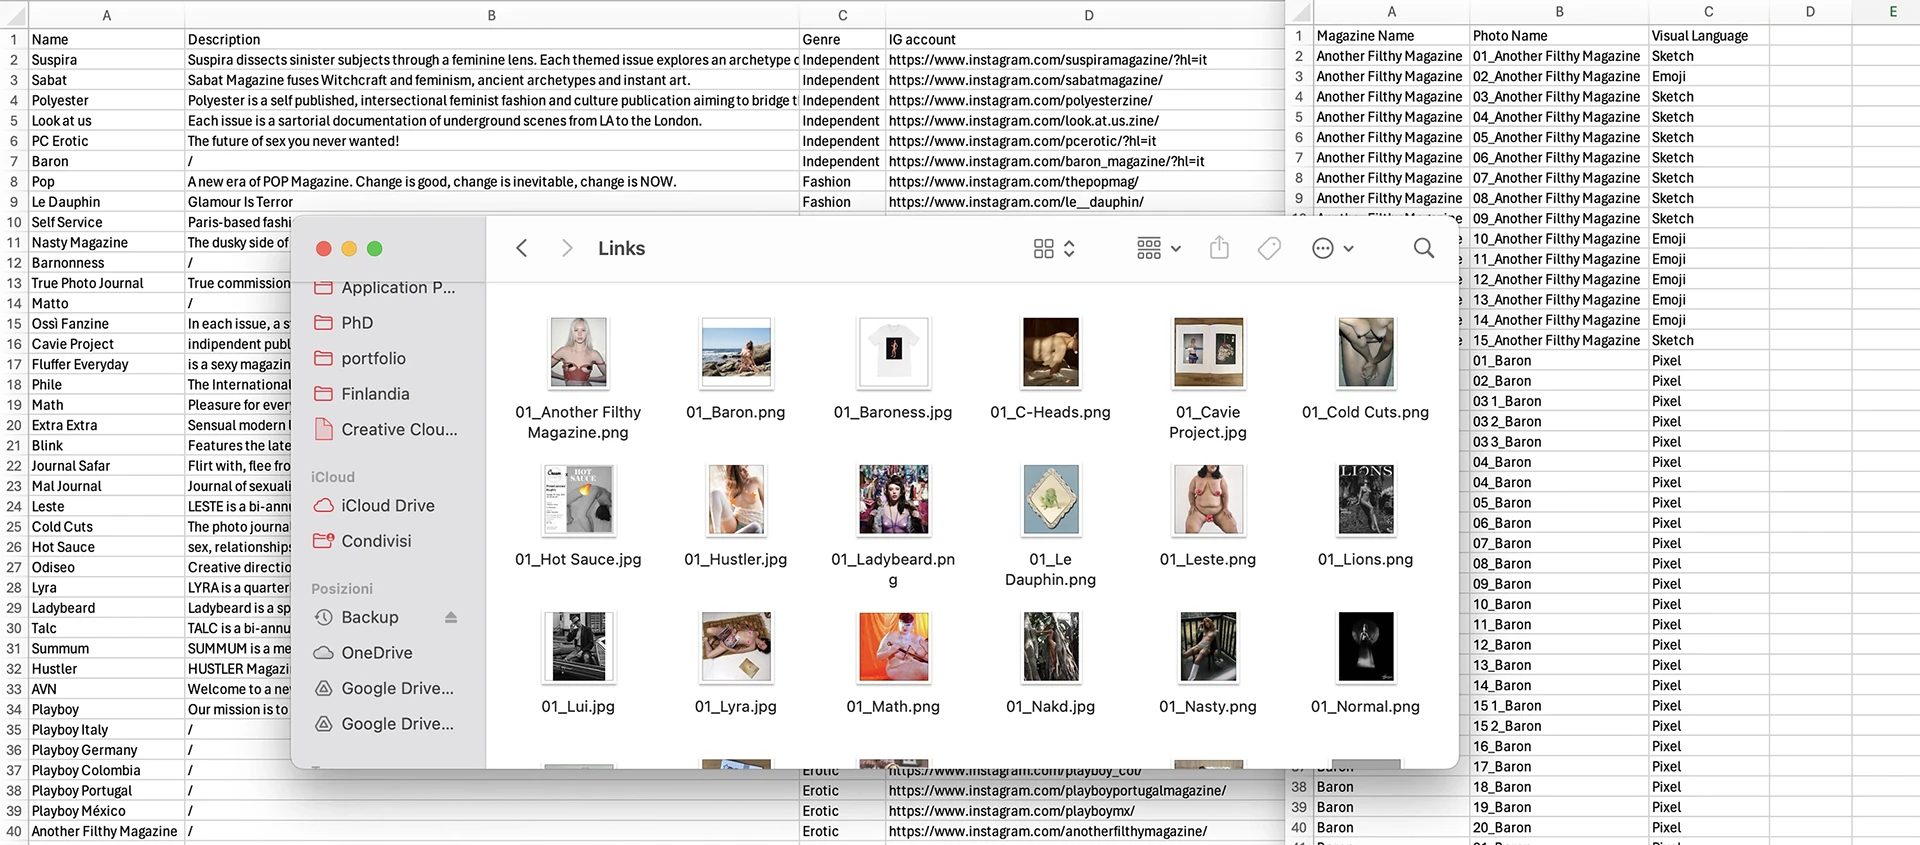
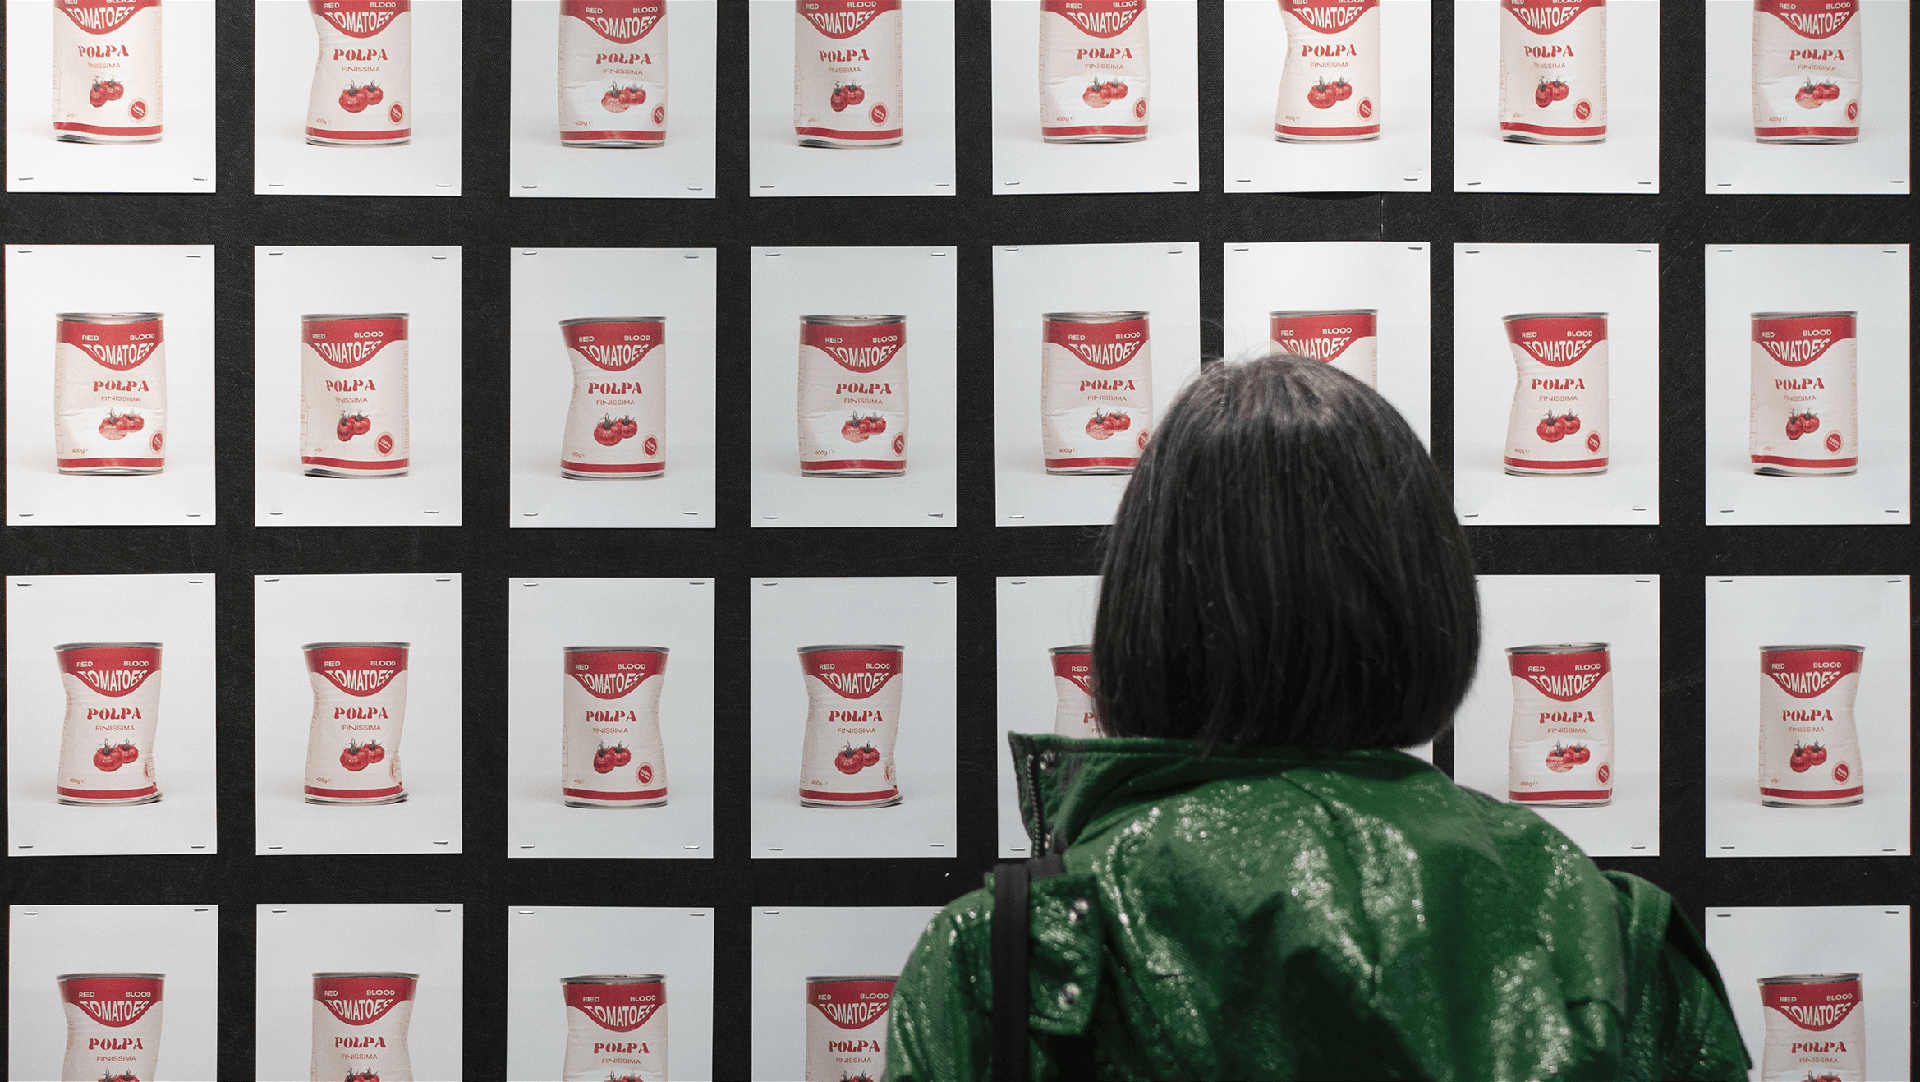
Noticing how some independent magazines self-censored their content to share on Instagram, I thought it would be interesting to map these techniques. I manually collected the names of erotic magazines via a Google search and further filtered them to focus on those actively using Instagram.
Using an Instagram scraper tool, I collected the first 200 images from each account, stored them in a database, and analyzed them to catalog the types of censorship applied.
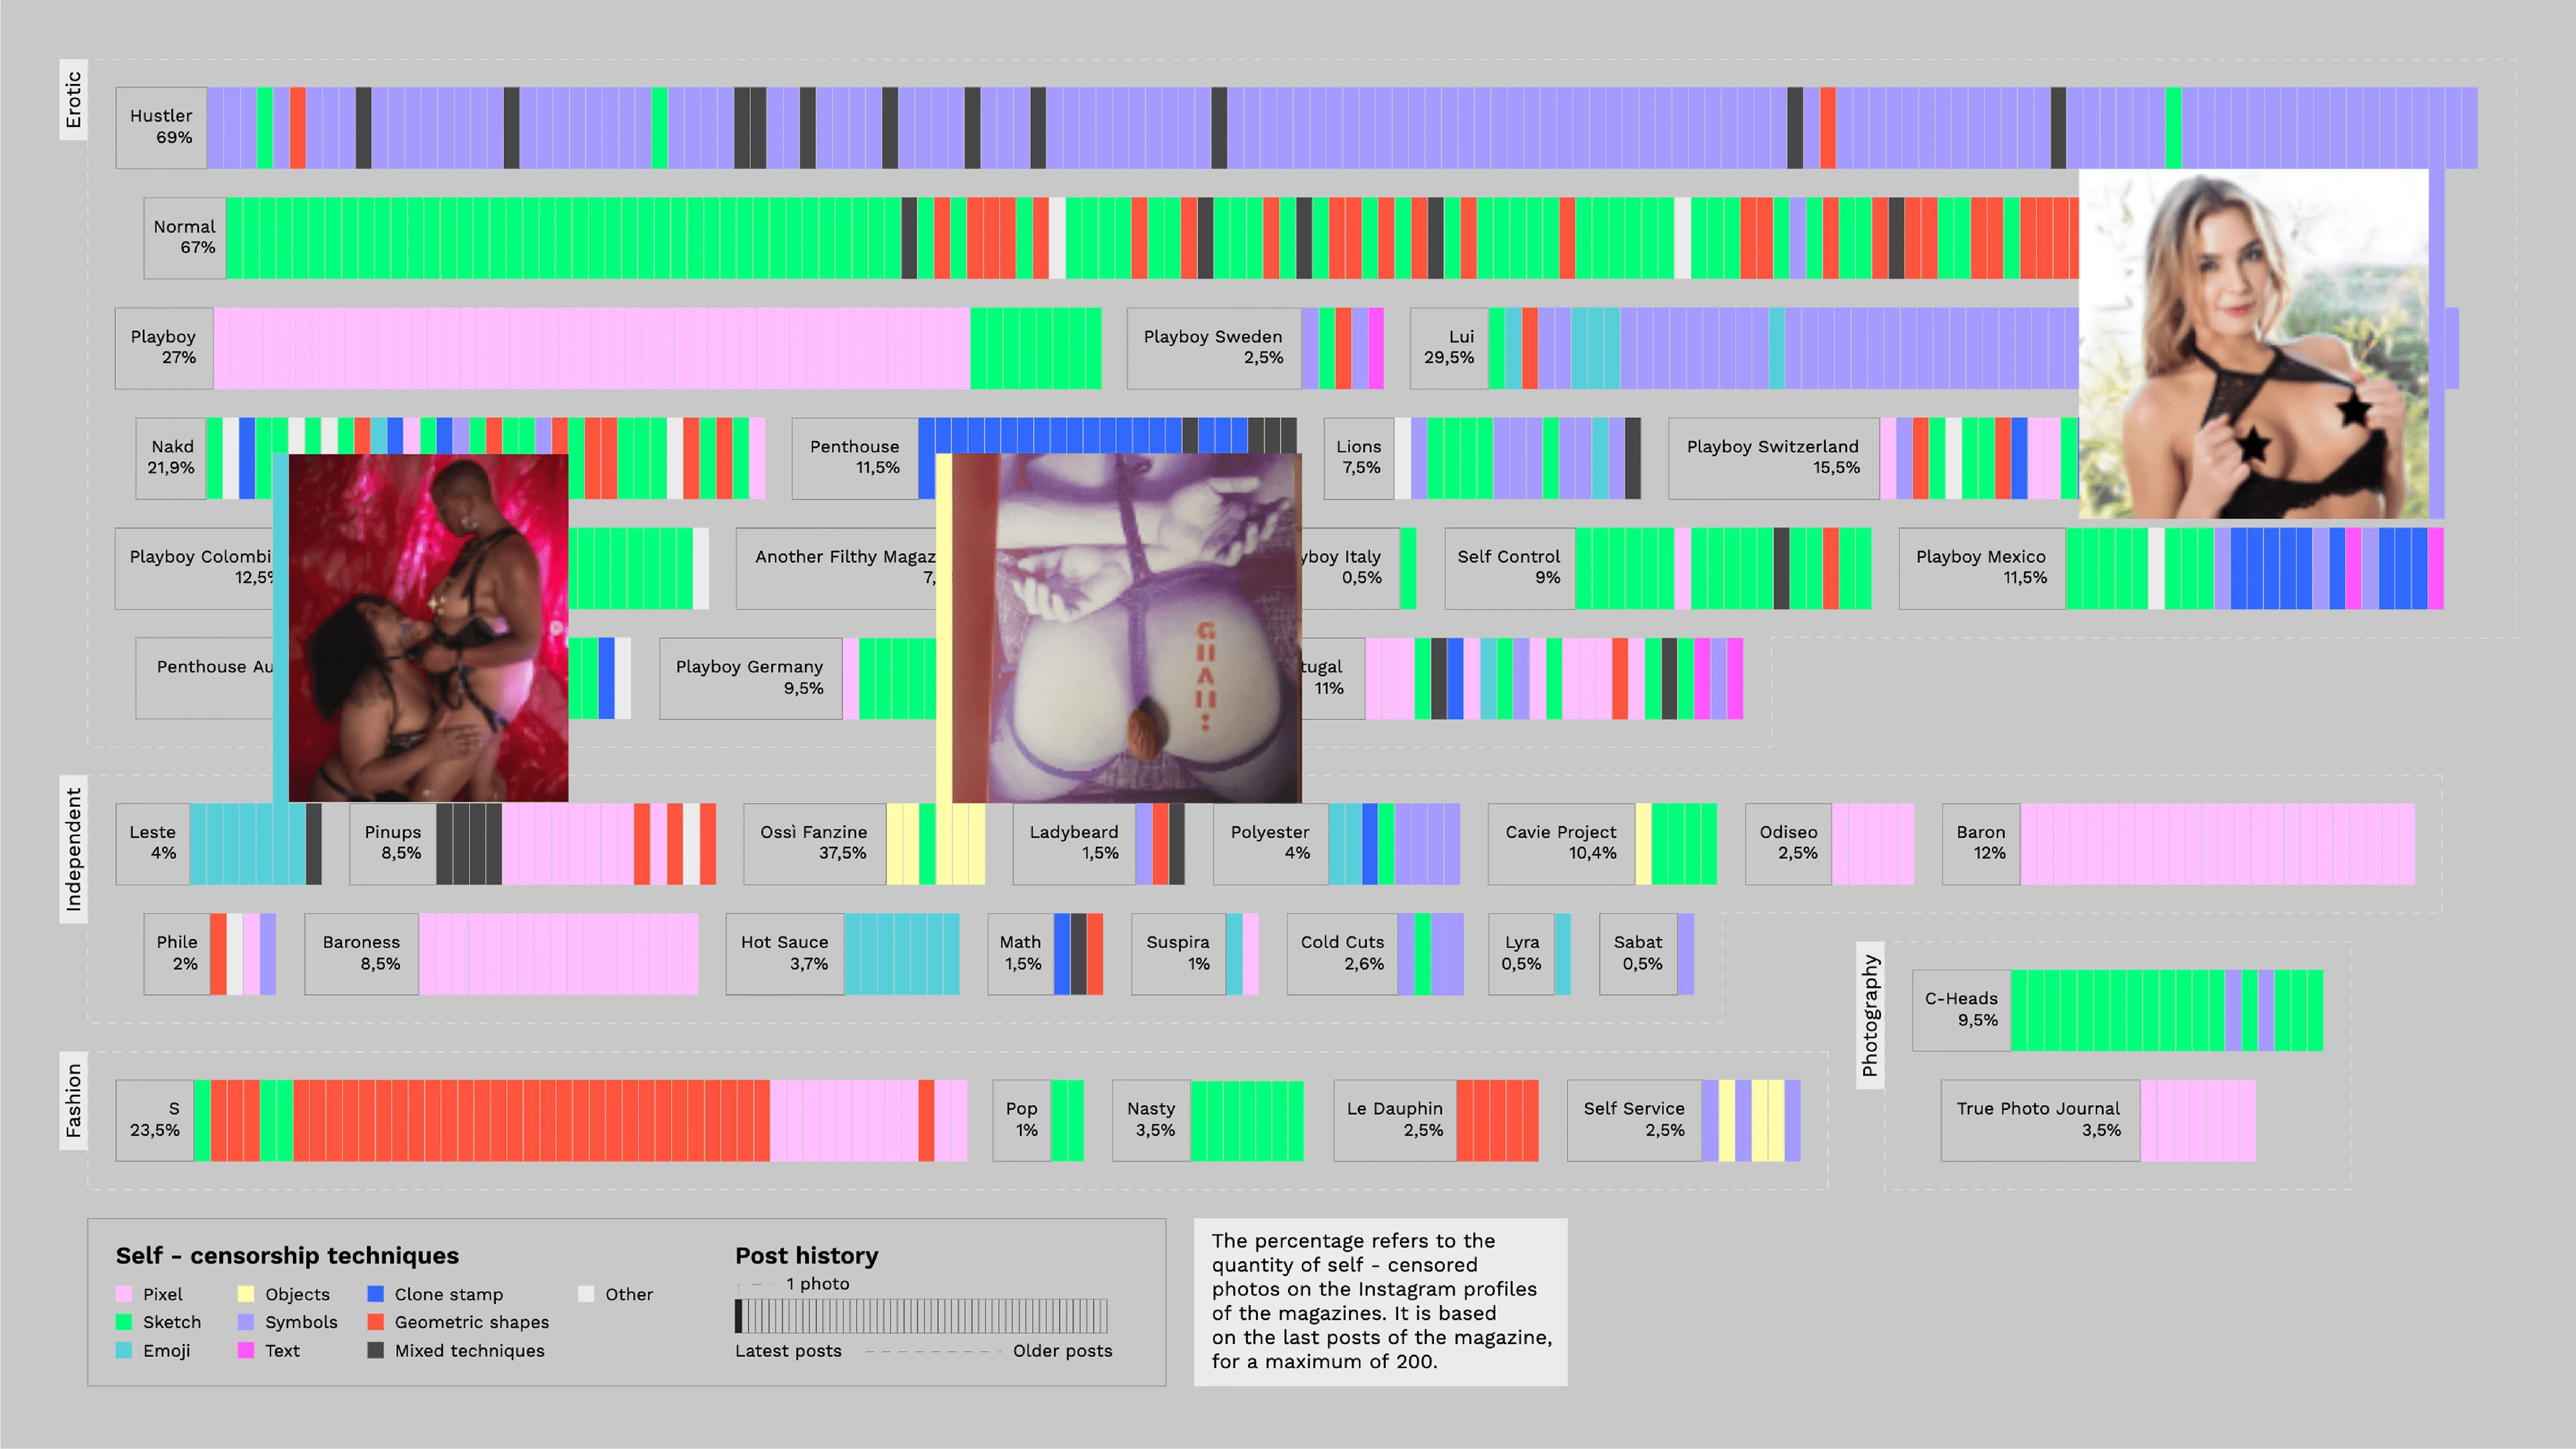
I designed the visualization to resemble an archive, where each self-censored picture is represented by a small rectangle, grouped by magazine, and colored according to the censorship technique. Hovering over a rectangle reveals the image, mimicking the physical navigation of a register. This visualization aimed to immediately show which magazines had the most self-censored images and the most used techniques.
Outcome
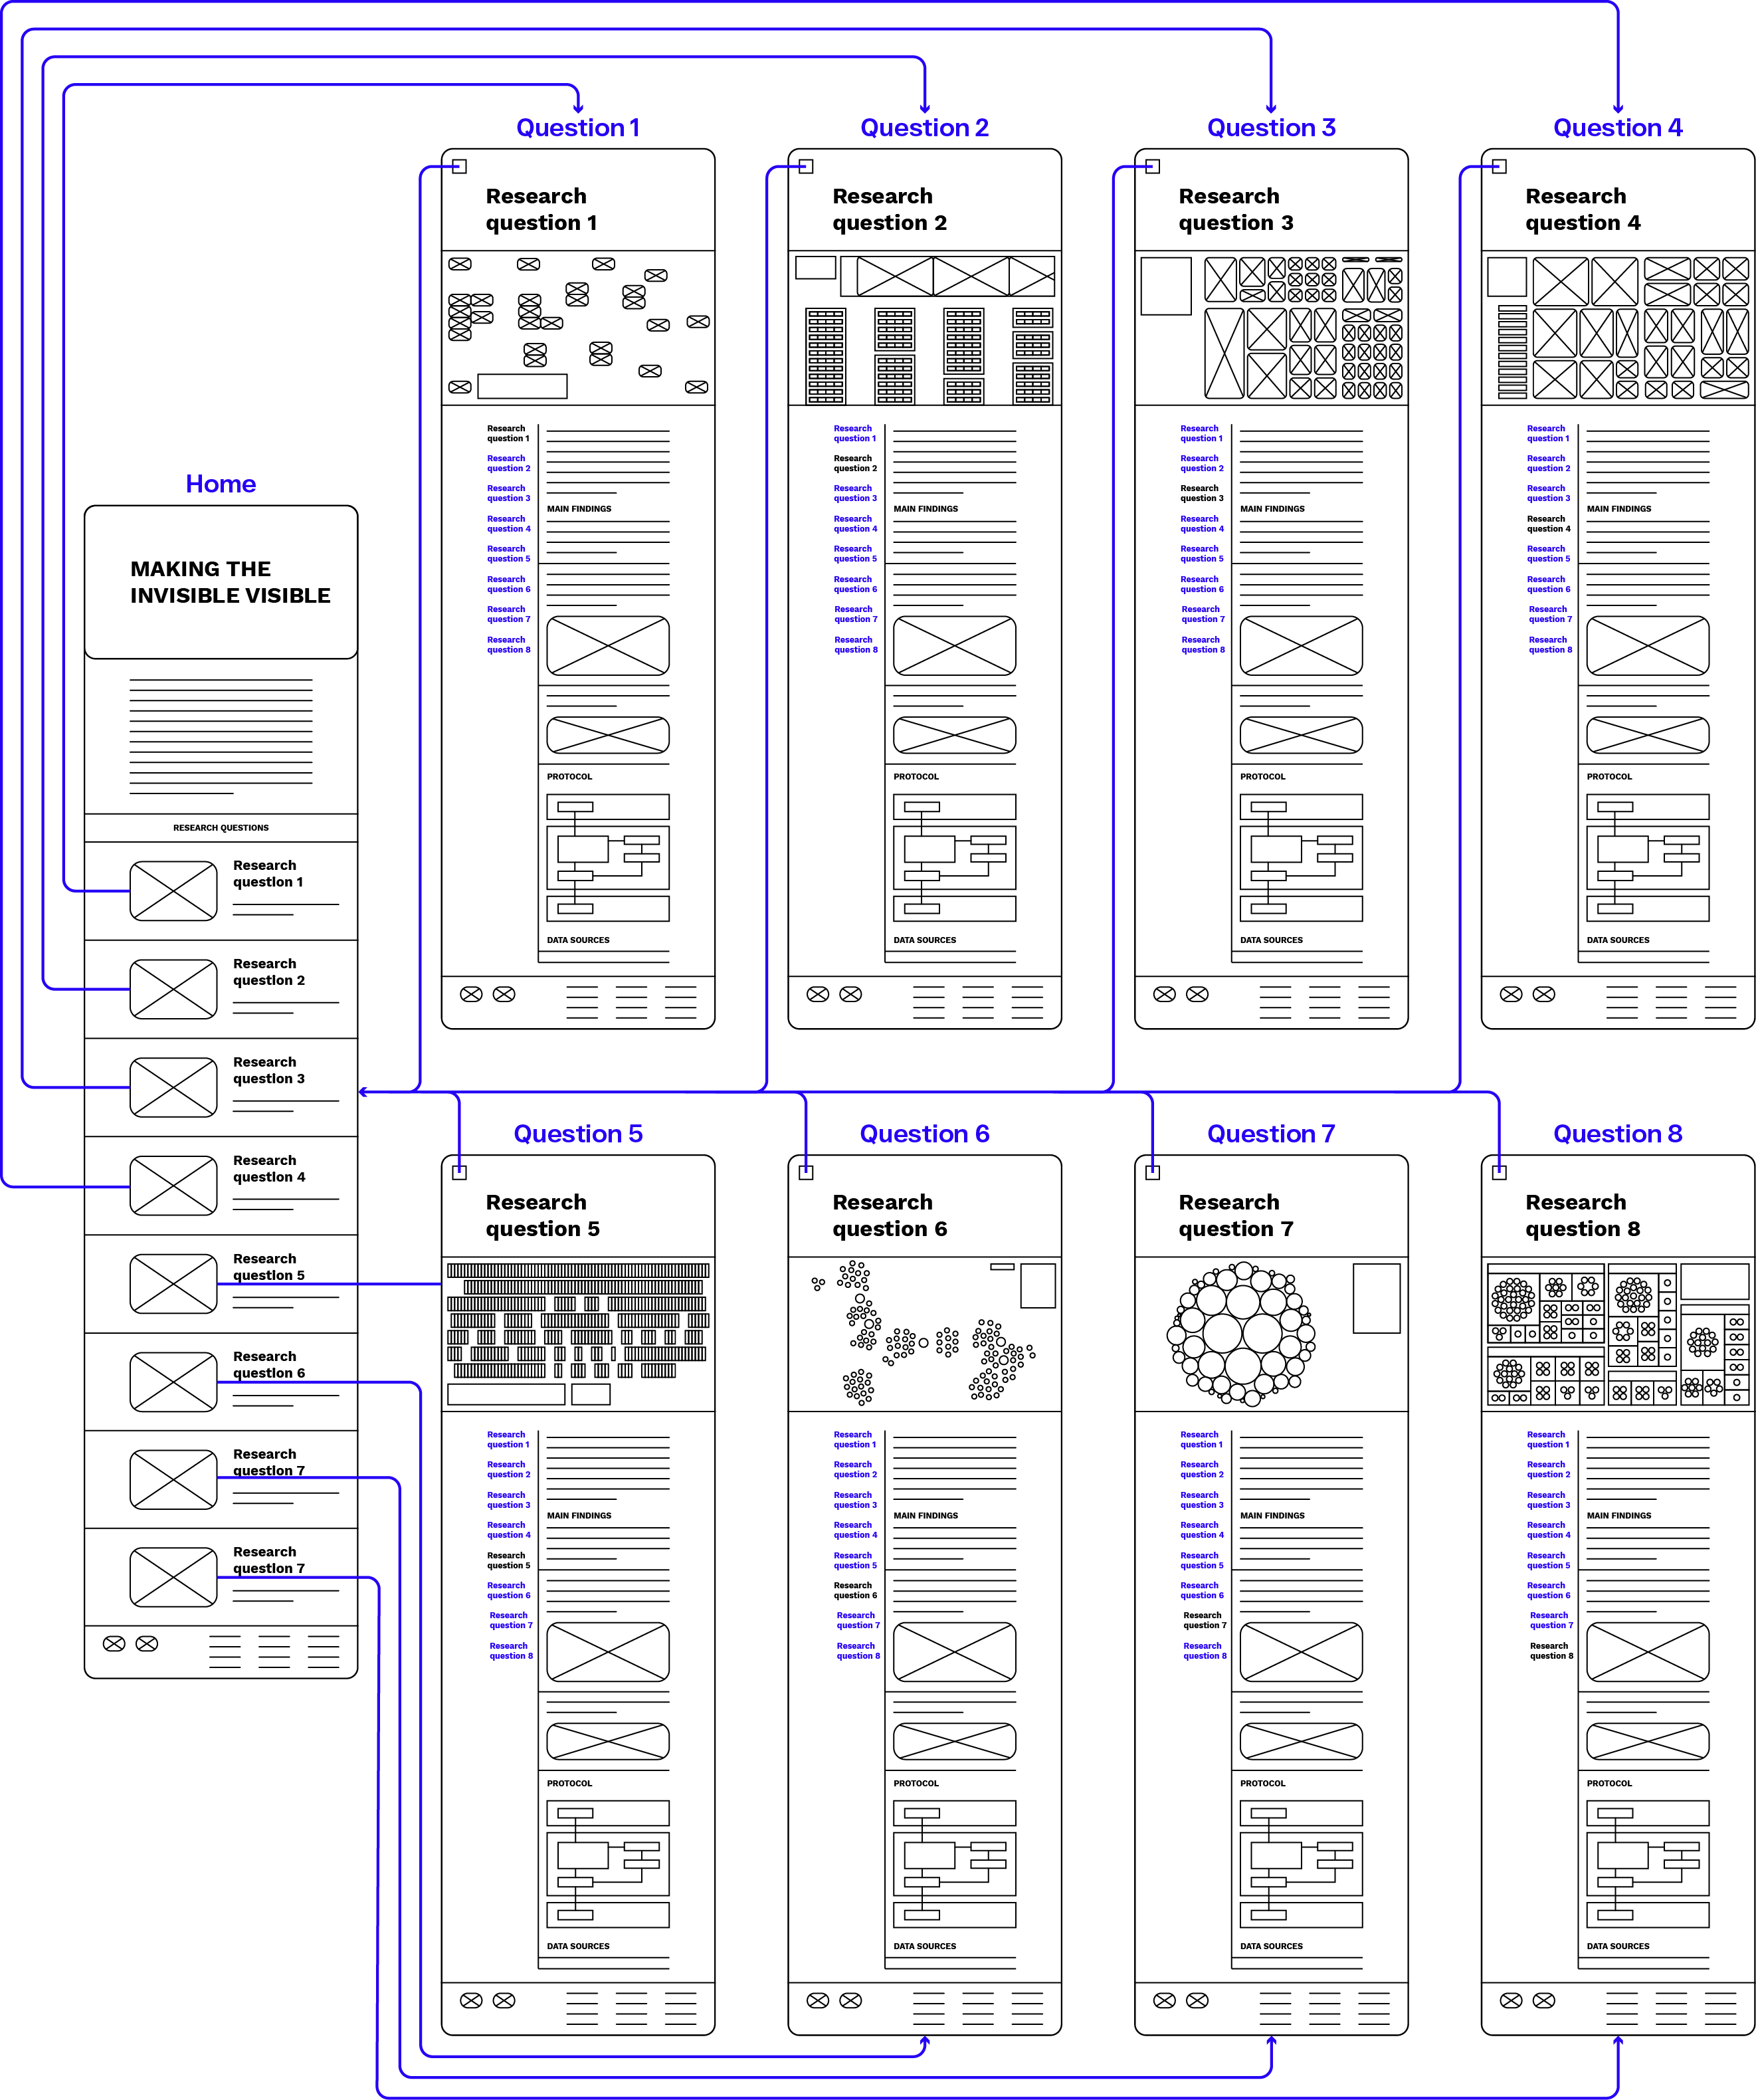
“Making the Invisible Visible” is a website that presents our research on online censorship of images. This digital report includes eight research protocols and related visualizations, along with explanatory texts, main findings, and protocol schemes.
User experience
We aimed to provide a comprehensive view of this phenomenon and provoke reflection on our findings.
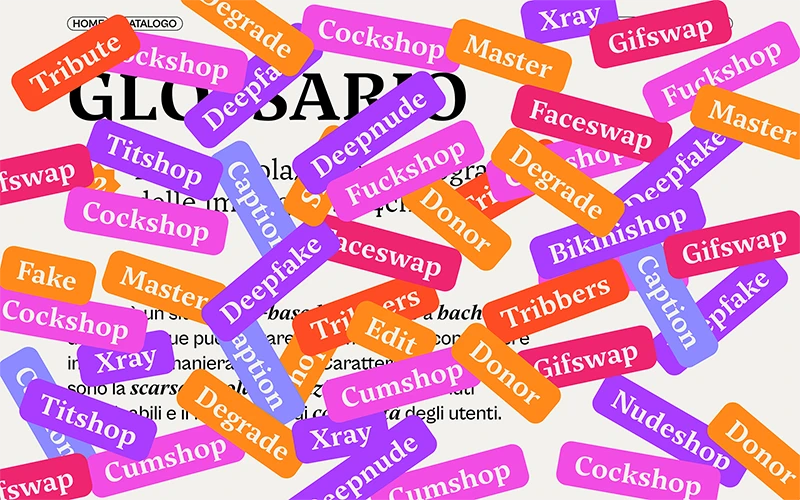
↑ Homepage
↑ Research question 2: How did the censorship of the researched places online change over time and which are the techniques used to censor them on Google Earth Pro?
↑ Research question 4: Does online censorship on social media treat women’s and men’s bodies equally?
↑ Research question 6: Which are the sub-topics related to freethenipplemovement on Instagram?
Result
“Making the Invisible Visible” effectively showcases our research findings, providing users with an interactive and engaging way to explore the complexities of online censorship. We received positive feedback highlighting the novelty of our research questions and findings, which made people think about themes and issues they had not previously considered. Research on censorship in Google Maps and erotic magazines’ self-censorship was particularly appreciated for their unique insights and innovative visualizations.
Skills: Data Visualization Design, Information Design, Qualitative Research, Digital Methods, Data Analysis, UX/UI Design
Team: Antonella Autuori, Elena Catani, Mattia Cittadino, Anna Gazza, Barbara Vanoli